Compendium: A Linux Syscall Tracer
github.com/louisboilard/compendium
Introduction
Compendium: A strace-like x86 Linux syscall tracer.
Want to know what a
program actually does? How it interacts with the OS?
Typically one might use strace, the output can be hard to parse and to make sense
of for non-trivial
programs. Having a love-hate relationship with strace I ended up yearning for something new.
Enter Compendium: a friendlier strace-like tool, with sane defaults, that
optionally produces a clean html report that you can view in your
browser of choice.
It tracks file descriptors across
their lifetime, distinguishes files from sockets, aggregates I/O stats,
registers events for memory operations (both vm and actual page
faults), threads/subprocesses and more
in real time and produces a summary at the end.
Here's what tracing curl looks like (cli output, not
html report):
compendium: tracing curl -s https://example.com
[+0.000s] ─── curl exec ───
[+0.002s] mmap 7f8a12345000-7f8a12347000 rw-   8.0 KB anon
[+0.003s] open /etc/resolv.conf (read)
[+0.015s] connect tcp4 → 93.184.216.34:443
[+0.156s] send    517 B
[+0.234s] recv   1.4 KB
[+0.235s] recv   1.2 KB

━━━━━━━━━━━━━━━━━━━━━━━━━━━━━━━━━━━━━━━━━━━━━━━━━━━━━━━━━━━━━━━━
 FINAL: curl -s https://example.com (0.34s)
━━━━━━━━━━━━━━━━━━━━━━━━━━━━━━━━━━━━━━━━━━━━━━━━━━━━━━━━━━━━━━━━
 Memory:
   Heap:     132.0 KB
   Mmap:     8.5 MB (24 regions)
   Total:    8.6 MB
 I/O:
   Files read:       12.4 KB
   Files written:       0 B
   Net sent:          517 B
   Net received:     2.6 KB
 Network connections:
   tcp4 → 93.184.216.34:443
 Exit: 0
━━━━━━━━━━━━━━━━━━━━━━━━━━━━━━━━━━━━━━━━━━━━━━━━━━━━━━━━━━━━━━━━
You can also attach to running processes with --pid,
track page faults with --faults, and generate
interactive HTML reports with --report.
Architecture Overview
Project layout overview:
src/
├── main.rs          ─ CLI, Tracer struct, poll event loop
├── types.rs         ─ Shared types: FdTable, ProcessState, MemoryStats
├── events.rs        ─ Event model: TraceEvent, EventKind
├── memory.rs        ─ Memory introspection: read strings/buffers from tracee
├── perf.rs          ─ Page fault tracking via perf_event_open
├── ptrace_ops.rs    ─ Ptrace lifecycle: spawn, attach, stop handling
├── summary.rs       ─ Post-run summary and report orchestration
├── syscalls.rs      ─ x86_64 syscall number → name mapping (360+ entries)
├── handlers/
│   ├── mod.rs       ─ Syscall entry/exit dispatch (libc::SYS_* constants)
│   ├── fd.rs        ─ File descriptor syscalls: open, socket, pipe, dup, close
│   ├── io.rs        ─ I/O syscalls: read, write, send, recv, sendfile
│   ├── mem.rs       ─ Memory syscalls: brk, mmap, munmap
│   ├── page_faults.rs ─ Page fault grouping and reporting
│   └── utils.rs     ─ Path filtering (should_ignore_path)
└── report/
    ├── mod.rs       ─ HTML report generation (embeds CSS + JS)
    ├── report.js    ─ Interactive timeline + event table
    └── report.css   ─ Report styling
The central piece is Tracer in main.rs,
which maintains runtime state: per-process tracking, memory stats,
I/O counters and the event log.
struct Tracer {
    config: Config,       // verbose, cmd_display, report_path, max_report_events
    processes: HashMap<Pid, ProcessState>,
    memory: HashMap<Pid, MemoryStats>,
    io: IoStats,
    summary: Summary,
    initial_pid: Option<Pid>,
    start_time: Instant,
    perf: PerfState,      // enabled, page_faults, page_size
    output_file: Option<File>,
    events: Vec<TraceEvent>,
    event_count: usize,
    total_heap_bytes: u64,
    interrupt_count: u8,
}
Each traced process gets its own ProcessState, which tracks
syscall entry/exit state, a file descriptor table, heap tracking via brk,
and a leader_pid that ties threads back to their parent process
for shared memory accounting:
struct ProcessState {
    in_syscall: bool,
    last_syscall: Option<u64>,
    last_syscall_args: [u64; 6],
    fd_table: FdTable,
    brk: ProcessBrk,
    leader_pid: Pid,
}
The event model is defined as a tagged enum (we use serde to serialize to JSON for the HTML report):
#[derive(Clone, Debug, Serialize)]
#[serde(tag = "type", rename_all = "snake_case")]
pub enum EventKind {
    Open { path: String, writable: bool },
    Connect { sock_type: String, remote_addr: String },
    Brk { growth_bytes: u64 },
    Mmap { addr: String, end_addr: String, size: u64, prot: String, map_type: String },
    Read { bytes: u64, filename: String, target: IoTarget },
    Write { bytes: u64, filename: String, target: IoTarget },
    Send { bytes: u64 },
    Recv { bytes: u64 },
    SpawnProcess { child_pid: i32 },
    SpawnThread { child_tid: i32 },
    Exec { program: String },
    ExitThread { exit_pid: i32, code: Option<i32>, signal: Option<String> },
    Fault { addr: String, region_name: String, prot: String },
    // ...
}
Ptrace: Intercepting Syscalls
Before diving into ptrace, it might help to have a broad
understanding of how debuggers work, since it's somewhat similar to
what we are doing.
When you set a breakpoint in GDB or in your debugger of choice, the debugger replaces the instruction
at that address with an int3 (opcode 0xCC)
instruction.
When the CPU hits this instruction, it raises a trap exception, the
kernel delivers SIGTRAP to the process, and since the
process is being ptraced, the debugger gets notified. The debugger
can then inspect registers, memory, and decide what to do next.
How debugger breakpoints work:

  Original code:           With breakpoint:
  ┌────────────────┐       ┌────────────────┐
  │ 0x401000: push │       │ 0x401000: int3 │ ← 0xCC byte inserted
  │ 0x401001: mov  │       │ 0x401001: mov  │
  │ 0x401003: call │       │ 0x401003: call │
  └────────────────┘       └────────────────┘
                                   │
                                   ▼
                           CPU executes int3
                                   │
                                   ▼
                           Kernel sends SIGTRAP
                                   │
                                   ▼
                           Debugger catches it via ptrace
For our tracer the difference is we don't want to set breakpoints at specific addresses.
We want
to intercept every system call. This is where ptrace's syscall
tracing mode comes in. Instead of patching code with int3,
the kernel itself stops the process at syscall boundaries and notifies
the tracer.
The ptrace syscall
ptrace is a syscall which has a libc wrapper function. The raw
syscall signature is:
long ptrace(enum __ptrace_request request, pid_t pid, void *addr, void *data);
The request parameter determines the operation. The main
ones we care about:
PTRACE_TRACEME    ─ "I want to be traced by my parent"
PTRACE_ATTACH     ─ Attach to an already-running process
PTRACE_SYSCALL    ─ Continue, but stop at next syscall entry/exit
PTRACE_GETREGS    ─ Read all general-purpose registers
PTRACE_PEEKDATA   ─ Read a word from the tracee's memory
PTRACE_SETOPTIONS ─ Configure tracing behavior (follow forks, etc.)
In Rust, we use the nix crate which provides safe wrappers
around these syscalls. When we write ptrace::traceme(),
it ultimately calls:
ptrace(PTRACE_TRACEME, 0, NULL, NULL);
The tracing flow
Here's how the pieces fit together when we trace a new process:
The tracee stops twice per syscall: once at entry (before the kernel executes it) and once at exit (after it returns). This lets us capture both the arguments (at entry) and the return value (at exit).
Implementation
To start tracing, we fork and call PTRACE_TRACEME in the
child before exec'ing the target program:
fn spawn_traced(command: &str, args: &[String]) -> Result<Pid> {
    match unsafe { fork() }? {
        ForkResult::Parent { child } => {
            waitpid(child, None)?;
            Ok(child)
        }
        ForkResult::Child => {
            ptrace::traceme().expect("ptrace(TRACEME) failed");
            let cmd = CString::new(command).unwrap();
            let mut argv: Vec<CString> = vec![cmd.clone()];
            argv.extend(args.iter().map(|a| CString::new(a.as_str()).unwrap()));
            match execvp(&cmd, &argv) {
                Ok(void) => match void {},
                Err(e) => panic!("execvp failed: {e}"),
            }
        }
    }
}
The child calls traceme() then execvp. The exec
generates a SIGTRAP that stops the child, and the parent
picks it up with waitpid. This is why every ptraced process
stops immediately after exec: the kernel knows the parent is tracing
and sends the signal automatically.
From there, the parent sets ptrace options to also trace forks, clones,
and execs, then begins the main loop with ptrace::syscall()
to resume and catch the next syscall boundary.
Alternatively, we can attach to an already-running process using
PTRACE_ATTACH:
fn attach_to_pid(pid: i32) -> Result<Pid> {
    let pid = Pid::from_raw(pid);
    if let Err(e) = ptrace::attach(pid) {
        if e == nix::errno::Errno::EPERM {
            anyhow::bail!(
                "Permission denied attaching to PID {}.\n\
                 This is likely due to kernel ptrace security settings.\n\
                 Try one of:\n\
                   1. Run as root: sudo compendium --pid {}\n\
                   2. Relax ptrace_scope: sudo sysctl kernel.yama.ptrace_scope=0",
                pid, pid
            );
        }
        return Err(e).context("Failed to attach to process");
    }
    waitpid(pid, None)?;
    Ok(pid)
}
The attach sends SIGSTOP to the target process, which
stops it and allows us to begin tracing. This requires either root
privileges or the CAP_SYS_PTRACE capability (or ptrace
scope restrictions being relaxed via
/proc/sys/kernel/yama/ptrace_scope).
Reading syscall arguments
At each syscall stop, we read registers to get the syscall number
and arguments on entry, and the return value on exit. For x86_64,
the syscall number is in orig_rax and the six arguments
are in rdi, rsi, rdx, r10, r8, r9:
x86_64 syscall calling convention:

  Syscall number:  rax (orig_rax after entry)
  Arguments:       rdi, rsi, rdx, r10, r8, r9
  Return value:    rax

  Example: openat(AT_FDCWD, "/etc/passwd", O_RDONLY)
  ┌────────┬─────────────────┐
  │ rax    │ 257 (openat)    │
  │ rdi    │ -100 (AT_FDCWD) │
  │ rsi    │ 0x7fff... (ptr) │ ──► "/etc/passwd"
  │ rdx    │ 0 (O_RDONLY)    │
  └────────┴─────────────────┘
fn handle_syscall(&mut self, pid: Pid) -> Result<()> {
    let regs = ptrace::getregs(pid).context("Failed to get registers")?;

    if !in_syscall {
        // Syscall ENTRY: capture number and args
        let syscall_num = regs.orig_rax;
        let args = [regs.rdi, regs.rsi, regs.rdx, regs.r10, regs.r8, regs.r9];
        // ...
    } else {
        // Syscall EXIT: capture return value, process the event
        let ret = regs.rax as i64;
        self.process_syscall_exit(pid, syscall_num, &last_args, ret);
    }
    Ok(())
}
We use orig_rax instead of rax because the
kernel overwrites rax with the return value after the
syscall executes. orig_rax preserves the original
syscall number across the entry/exit boundary.
The toggle between entry and exit is tracked per-process via
in_syscall in ProcessState. Each
SIGTRAP flips this flag.
For more on ptrace: ptrace(2) man page, Wikipedia, Linux kernel syscall docs.
FD Tracking
Raw syscall traces tells us "process wrote 1024 bytes to fd 7", which isn't too useful without knowing what fd 7 is. We therefore maintain a per-process file descriptor table that maps each fd to its kind:
#[derive(Clone, Debug)]
enum FdKind {
    File { path: String, writable: bool },
    Socket { sock_type: String, remote: Option<String> },
    Pipe,
    Other,
}

#[derive(Clone, Default)]
struct FdTable {
    fds: HashMap<u64, FdKind>,
}
When we see an openat syscall return successfully, we
register the fd. When we see socket(), we register it
as a socket with its type (tcp4, udp4, tcp6, unix, etc.). When
connect() completes, we update the socket's remote
address. The fd table also handles close,
dup/dup2/dup3, and pipe/pipe2.
This tracking is what lets us attribute I/O correctly. When we see
a read or write syscall, we look up the fd
to determine if it's file I/O or network I/O, and we can report
the actual filename instead of just a number:
// Dispatch uses libc::SYS_* integer constants, simplified here:
libc::SYS_read | libc::SYS_pread64 | libc::SYS_readv | libc::SYS_preadv if ret > 0 => {
    let fd = args[0];
    let bytes = ret as u64;

    if proc.fd_table.is_socket(fd) {
        self.io.net_bytes_received += bytes;
        self.record_event(pid, EventKind::Recv { bytes });
    } else if proc.fd_table.is_file(fd) {
        let name = proc.fd_table.file_name(fd).unwrap_or("?");
        self.io.file_bytes_read += bytes;
        self.record_event(pid, EventKind::Read {
            bytes, filename: name, target: IoTarget::File,
        });
    }
}
The distinction matters for the summary: file bytes read vs net bytes sent are tracked separately, and network connections appear in their own section of the final output.
Memory Tracking: brk and mmap
Programs allocate memory through two main syscalls: brk
(which grows (extends) the heap region) and mmap (which maps new virtual
memory regions). If you want to learn more see my post about memory
and allocators.
For brk, we record the initial break address and
track growth over time:
#[derive(Default)]
struct ProcessBrk {
    initial_brk: Option<u64>,
    current_brk: u64,
}

impl ProcessBrk {
    fn update(&mut self, new_brk: u64) -> Option<u64> {
        if self.initial_brk.is_none() && new_brk > 0 {
            self.initial_brk = Some(new_brk);
        }
        let old_brk = self.current_brk;
        if new_brk > 0 {
            self.current_brk = new_brk;
        }
        // Return growth if heap grew
        if old_brk > 0 && new_brk > old_brk {
            Some(new_brk - old_brk)
        } else {
            None
        }
    }

    fn heap_size(&self) -> u64 {
        match self.initial_brk {
            Some(initial) if self.current_brk > initial => self.current_brk - initial,
            _ => 0,
        }
    }
}
For mmap, we track each region with its address, size,
permissions, and whether it's file-backed or anonymous:
#[derive(Clone)]
struct MmapRegion {
    size: u64,
    name: String,  // filename or "anon"
    prot: String,  // "rwx" style
}

#[derive(Default)]
struct MemoryStats {
    mmap_regions: HashMap<u64, MmapRegion>,  // addr -> region info
    mmap_total: u64,
}
We also handle munmap to remove regions when they're
freed, keeping the stats accurate over the lifetime of the process.
This region tracking also feeds into page fault analysis:
when a fault address arrives, we look it up against the region map
to determine which allocation it belongs to.
The Event Loop
The main loop needs to handle two kinds of events: tracee stops
(delivered via SIGCHLD) and page fault samples
(delivered via perf). To multiplex these without busy-waiting,
we convert SIGCHLD into a pollable file descriptor
using signalfd, then use poll() to
wait on both:
// Block SIGCHLD and create a signalfd for it
let mut mask = SigSet::empty();
mask.add(Signal::SIGCHLD);
mask.thread_block().context("Failed to block SIGCHLD")?;
let signal_fd = SignalFd::with_flags(&mask, SfdFlags::SFD_NONBLOCK)?;

// Set ptrace options: trace forks, clones, and execs
let options = ptrace::Options::PTRACE_O_TRACEFORK
    | ptrace::Options::PTRACE_O_TRACEVFORK
    | ptrace::Options::PTRACE_O_TRACECLONE
    | ptrace::Options::PTRACE_O_TRACEEXEC;
ptrace::setoptions(initial_pid, options)?;
ptrace::syscall(initial_pid, None)?;

loop {
    let mut poll_fds = vec![libc::pollfd {
        fd: signal_fd.as_raw_fd(),
        events: libc::POLLIN,
        revents: 0,
    }];
    if let Some(ref perf) = perf_tracker {
        poll_fds.push(libc::pollfd {
            fd: perf.raw_fd(),
            events: libc::POLLIN,
            revents: 0,
        });
    }

    // Wait for either tracee event or perf event
    unsafe { libc::poll(poll_fds.as_mut_ptr(), poll_fds.len() as libc::nfds_t, -1) };

    // Process page faults first (they may predate the current syscall)
    if poll_fds.len() > 1 && poll_fds[1].revents & libc::POLLIN != 0 {
        self.process_page_faults(perf);
    }

    // Drain all pending wait statuses
    if poll_fds[0].revents & libc::POLLIN != 0 {
        let _ = signal_fd.read_signal();
        loop {
            match waitpid(None, Some(WaitPidFlag::__WALL | WaitPidFlag::WNOHANG)) {
                Ok(WaitStatus::StillAlive) => break,
                Ok(WaitStatus::Stopped(pid, Signal::SIGTRAP)) => {
                    self.handle_syscall(pid)?;
                    ptrace::syscall(pid, None)?;
                }
                Ok(WaitStatus::PtraceEvent(pid, _, event)) => {
                    // Handle fork, clone, exec events
                    // ...
                    ptrace::syscall(pid, None)?;
                }
                Ok(WaitStatus::Exited(pid, code)) => {
                    self.processes.remove(&pid);
                    if self.processes.is_empty() { return Ok(()); }
                }
                // ...
            }
        }
    }
}
This design has a few important properties. Using signalfd
instead of a signal handler means we never have to worry about
async-signal-safety. The poll() call blocks the
tracer when nothing is happening (no busy loop). And we drain
all pending waitpid results in a loop with
WNOHANG, because a single SIGCHLD might
correspond to multiple stopped tracees.
Non-trap signals (like SIGTERM sent to the tracee)
are forwarded transparently (aka we pass them through to the tracee
via ptrace::syscall(pid, Some(sig)) so the traced
program behaves as if it weren't being traced).
Page Fault Tracking via perf_event_open
Virtual memory means that a program can have 8 MB of mmap'd regions without actually using 8 MB of physical memory. The kernel maps pages lazily (physical memory is only allocated when the page is first touched), which triggers a minor page fault. Tracking these faults tells us how much memory a program actually uses, not just how much it requested.
We use perf_event_open to monitor minor
page faults. The implementation wraps the perf-event crate:
pub struct PerfPageFaultTracker {
    sampler: Sampler,
}

impl PerfPageFaultTracker {
    pub fn new(pid: Pid) -> io::Result<Self> {
        let counter = Builder::new(Software::PAGE_FAULTS_MIN)
            .observe_pid(pid.as_raw())
            .any_cpu()
            .sample_period(1)  // Every fault
            .sample(SampleFlag::TID)
            .sample(SampleFlag::ADDR)
            .exclude_kernel(true)
            .exclude_hv(true)
            .wakeup_events(1)
            .build()?;

        let mut sampler = counter.sampled(8192)?;  // 8KB ring buffer
        sampler.enable()?;
        Ok(Self { sampler })
    }
}
Each fault sample includes the TID (thread id) and faulting address. We look up the address in our brk/mmap region map to figure out whether the fault was in the heap, an anonymous mapping, or a file-backed region. Only heap and anonymous faults are reported since those represent actual memory growth.
Consecutive faults in the same region are grouped to reduce
noise. Instead of printing 200 individual fault lines for a
large allocation that touches many pages, you get a single
line like 200 faults in heap @ 5574a0000000 (rw-).
Multi-Process and Thread Support
We trace all subprocesses/threads automatically via ptrace options:
PTRACE_O_TRACEFORK   ─ catch fork()
PTRACE_O_TRACEVFORK  ─ catch vfork()
PTRACE_O_TRACECLONE  ─ catch clone() (threads)
PTRACE_O_TRACEEXEC   ─ catch execve()
The key design decision is how to handle shared state between
threads. When clone() is used to create a thread
(shared address space), we set the new thread's
leader_pid to its parent's leader. Memory stats
(mmap regions) are keyed by leader, so all threads in the same
process share one set of memory stats:
// When a clone event creates a thread:
let parent_leader = self.processes.get(&pid)
    .map(|p| p.leader_pid)
    .unwrap_or(pid);
self.add_process(new_tid);
if let Some(proc) = self.processes.get_mut(&new_tid) {
    proc.leader_pid = parent_leader;
}

// Memory lookup always goes through the leader:
fn memory_for(&mut self, pid: Pid) -> &mut MemoryStats {
    let leader = self.processes.get(&pid)
        .map(|p| p.leader_pid)
        .unwrap_or(pid);
    self.memory.entry(leader).or_default()
}
On exec, the address space is completely replaced,
so we reset brk tracking, clear the fd table (CLOEXEC fds are
closed by the kernel), and clear all mmap regions.
When multiple processes/threads are active, the output includes
PIDs in the event prefix: [+0.003s] [1234] instead
of just the time/progress, so you can follow which task
is doing what.
Interactive HTML Reports
Use --report flag to generate a self-contained HTML file
with an interactive visualization of the trace. The report embeds
all CSS and JavaScript via include_str!, so it's a
single file with no external deps.
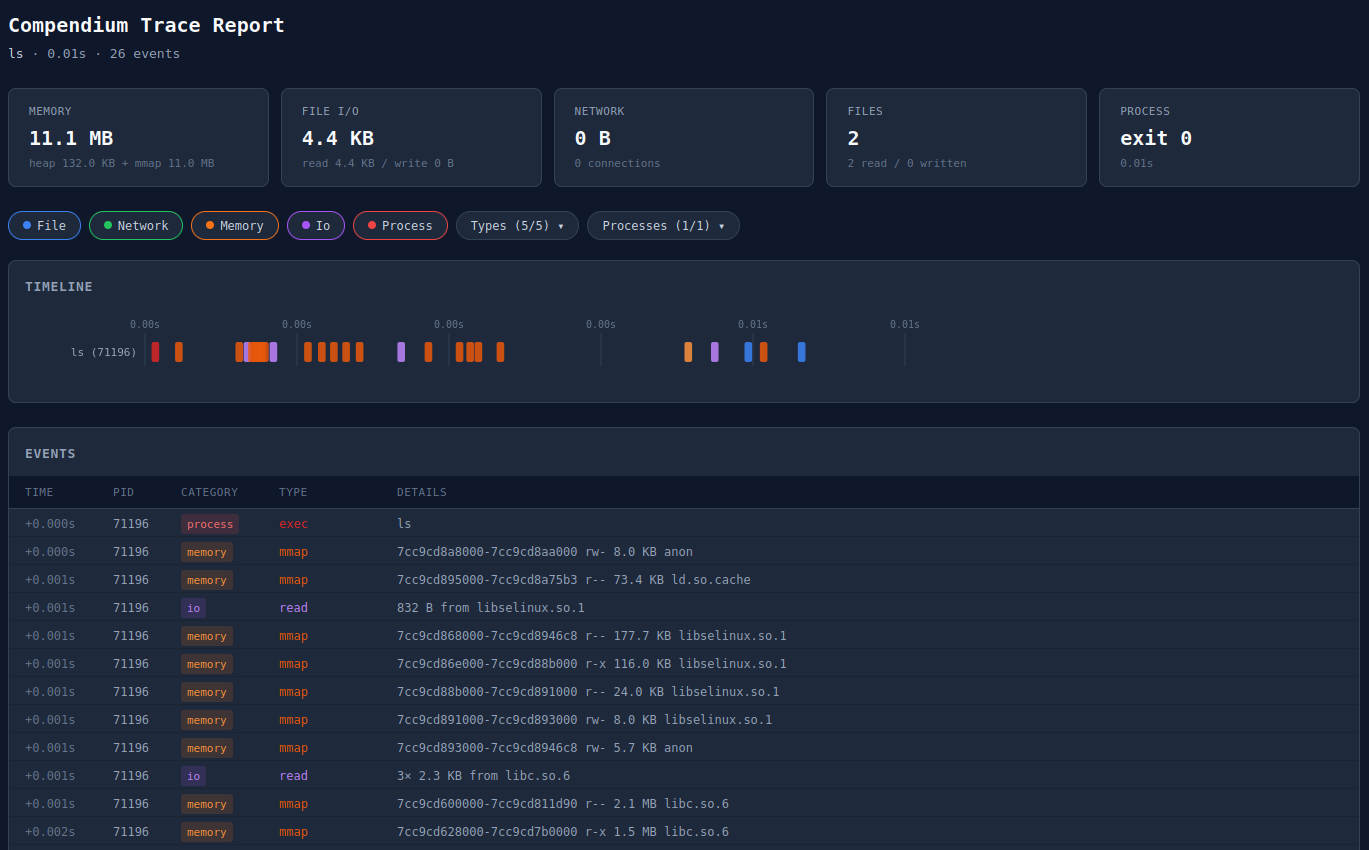
Interactive HTML report: self-contained syscall trace visualization
Noise Filtering
Raw syscall trace (like via strace or when running with --verbose) of even a simple program like ls
produces hundreds of events, most of them loading shared libraries
and reading /proc. We filter out the exec runtime ceremony to focus
on what the tracee actually does.
The filtering is super simple:
fn should_ignore_path(path: &str) -> bool {
    path.starts_with("/proc/")
        || path.starts_with("/sys/")
        || path.starts_with("/dev/")
        || path.contains("/ld.so")
        || path.contains("ld-linux")
        || path == "/etc/ld.so.cache"
        || (is_lib_dir(path) && (path.ends_with(".so") || path.contains(".so.")))
}

fn is_lib_dir(path: &str) -> bool {
    path.starts_with("/lib/")
        || path.starts_with("/lib64/")
        || path.starts_with("/usr/lib/")
        || path.starts_with("/usr/lib64/")
        || path.starts_with("/nix/store/")
}
/proc, /sys, and /dev
are virtual filesystems that are read for system
information, typically not useful for understanding program behavior.
The dynamic linker (ld.so, ld-linux)
and shared libraries (.so files) are filtered
because every dynamically linked program loads them and it's
basically just noise.
Localhost connections (127.0.0.1, 127.0.0.53)
are also filtered from the network connection summary, since
they're typically DNS or loopback traffic rather than actual
network communication. This might be a bad take on my end but I did
find filtering these out useful.
These filters only affect the terminal output and events. If you
want the raw view, --verbose shows every syscall
as it happens, before any filtering.
Conclusion
The objective of this tool is to try to sit in a useful spot between strace
(too raw) and full observability platforms (too heavy). It gives
you a quick, clear answer to "what does this program actually do?"
with enough detail to debug file access, network activity, and
memory behavior without drowning you in noise.
github.com/louisboilard/compendium